To monitor a .NET application with OpenTelemetry and Grafana, install the OpenTelemetry hosting and instrumentation packages, call AddOpenTelemetry() in Program.cs, and point the OTLP exporter at your Grafana Cloud stack with three settings: endpoint, protocol, and an authorization header.
Traces and logs then show up in Grafana, with automatic correlation between them.
Gen AI is everywhere these days, but it can be hard to figure out where to start. SambaNova Cloud lets you build with the best open source models from Llama, DeepSeek, OpenAI and more, all optimized for speed. They have integrations to popular frameworks and tools (like Hugging Face, CrewAI, and Cline), APIs for building, and a playground to test things out. Get started with SambaNova Cloud today.
ABP Studio 1.0 is Here: Develop .NET Apps Visually and Fast. The stable version of ABP Studio 1.0 is now officially available! It's a full-featured visual development environment for ABP.IO—generate modules, configure entities, and scaffold UIs in minutes. Skip the boilerplate. Focus on what matters. Explore ABP Studio 1.0
Your .NET application is running in production, but you're flying blind.
When something breaks, you're stuck digging through logs, guessing at performance bottlenecks, and trying to piece together what actually happened across your distributed system.
That ends today.
Grafana is a complete observability platform that unifies metrics, logs, and traces in one place.
With Grafana, you get:
- Unified dashboards that combine metrics, logs, and traces
- Advanced alerting that actually works when things go wrong
- Deep trace analysis to understand request flows across services
- Log correlation that connects your traces to the exact log entries that matter
Grafana Cloud makes this even easier. No infrastructure to manage, automatic scaling, and built-in integrations with OpenTelemetry. There's a generous free tier that allows you to get started without any upfront costs.
When you combine Grafana with OpenTelemetry, you get vendor-neutral observability that actually delivers insights instead of just pretty charts.
Setting Up OpenTelemetry in .NET
First, install the core OpenTelemetry packages:
Install-Package OpenTelemetry.Extensions.Hosting
Install-Package OpenTelemetry.Exporter.OpenTelemetryProtocol
Install-Package OpenTelemetry.Instrumentation.AspNetCore
Install-Package OpenTelemetry.Instrumentation.Http
You can also add instrumentation for other libraries as needed:
Install-Package OpenTelemetry.Instrumentation.EntityFrameworkCore
Install-Package OpenTelemetry.Instrumentation.StackExchangeRedis
Install-Package Npgsql.OpenTelemetry
Configure OpenTelemetry in your Program.cs:
var builder = WebApplication.CreateBuilder(args);

builder.Services
    .AddOpenTelemetry()
    .ConfigureResource(resource => resource.AddService(serviceName))
    .WithTracing(tracing =>
    {
        tracing
            .AddAspNetCoreInstrumentation()
            .AddHttpClientInstrumentation()
            .AddEntityFrameworkCoreInstrumentation()
            .AddRedisInstrumentation()
            .AddNpgsql();

        tracing.AddOtlpExporter();
    });

builder.Logging.AddOpenTelemetry(logging =>
{
    logging.IncludeScopes = true;
    logging.IncludeFormattedMessage = true;

    logging.AddOtlpExporter();
});

var app = builder.Build();

// Your app configuration...

app.Run();
This configuration:
- Sets up tracing with OpenTelemetry
- Sets up automatic instrumentation for ASP.NET Core and HTTP requests
- Adds Entity Framework Core and Redis instrumentation
- Configures PostgreSQL instrumentation if you're using Npgsql
- Configures OTLP export for traces and logs (we can also add metrics later)
Configuring OTLP Export to Grafana Cloud
Get your Grafana Cloud credentials:
-
Log into Grafana Cloud
-
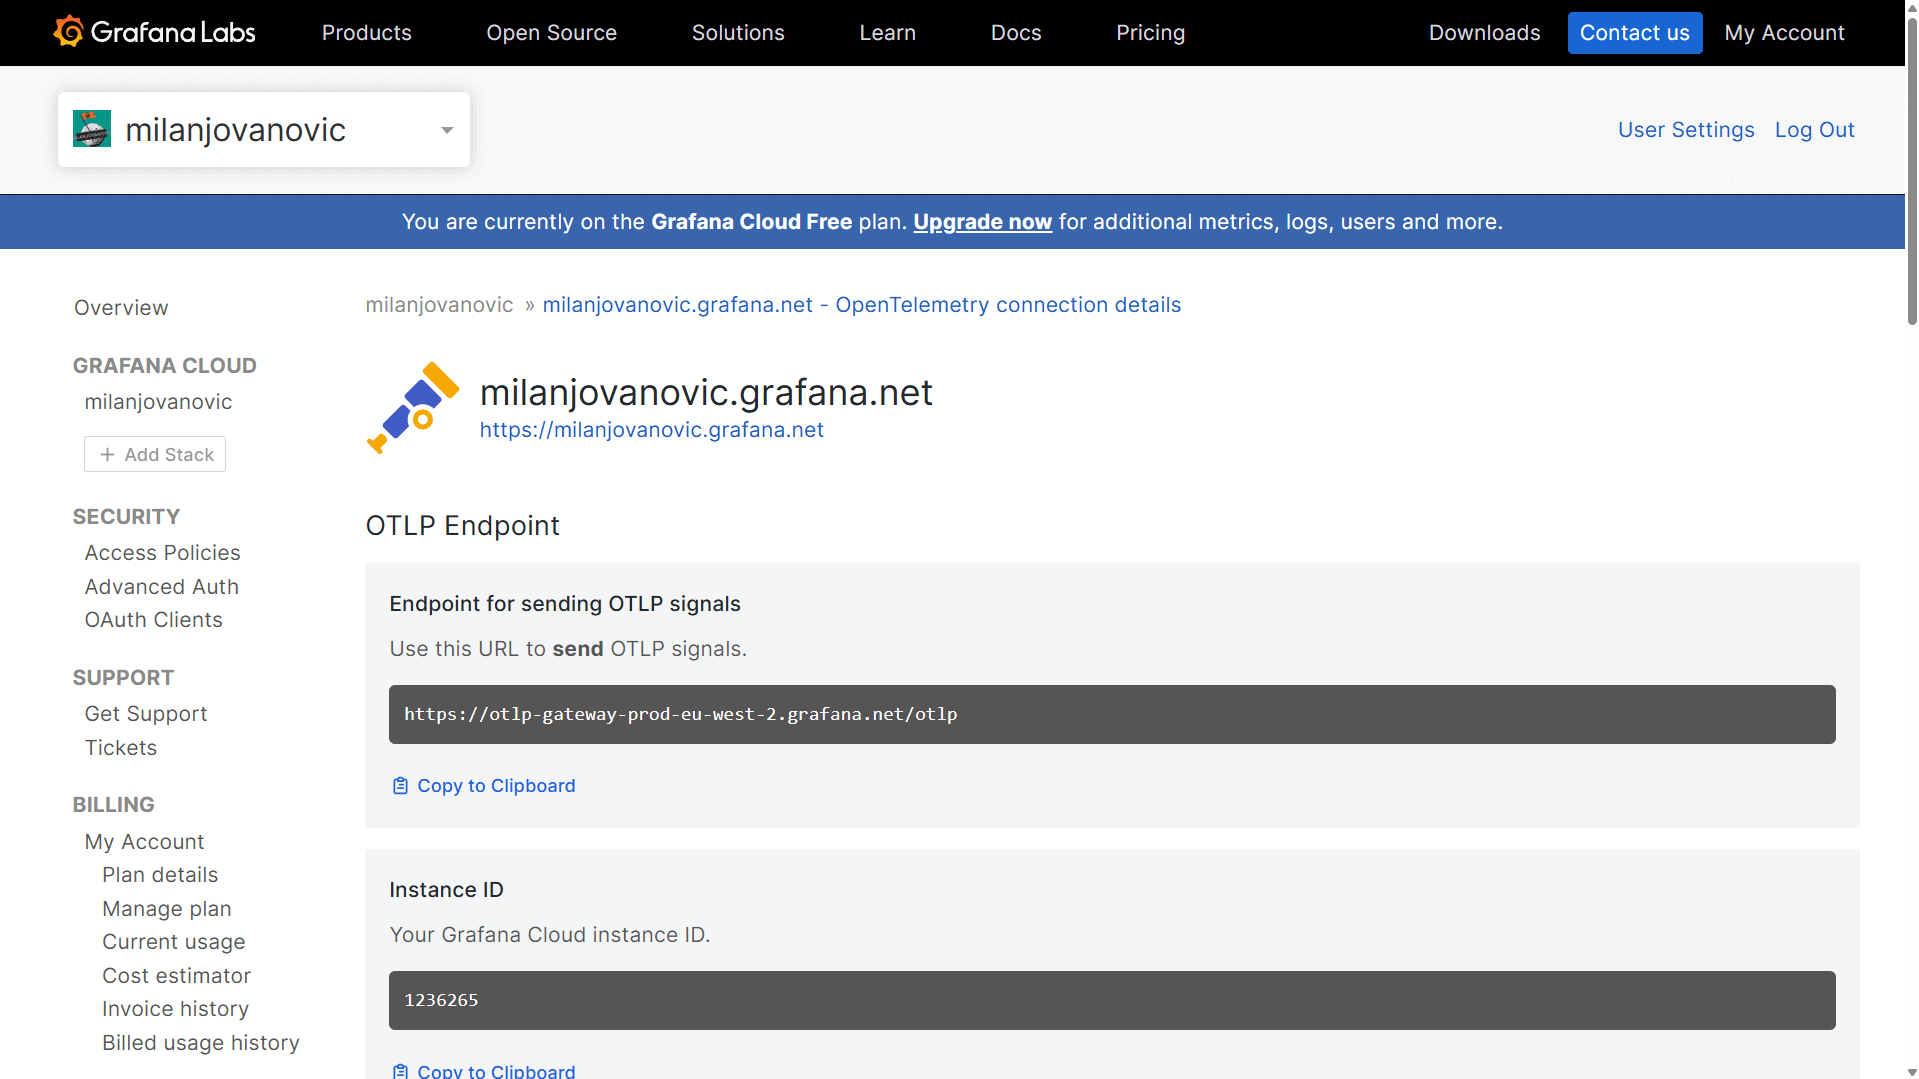
Go to My Account → Stack Details
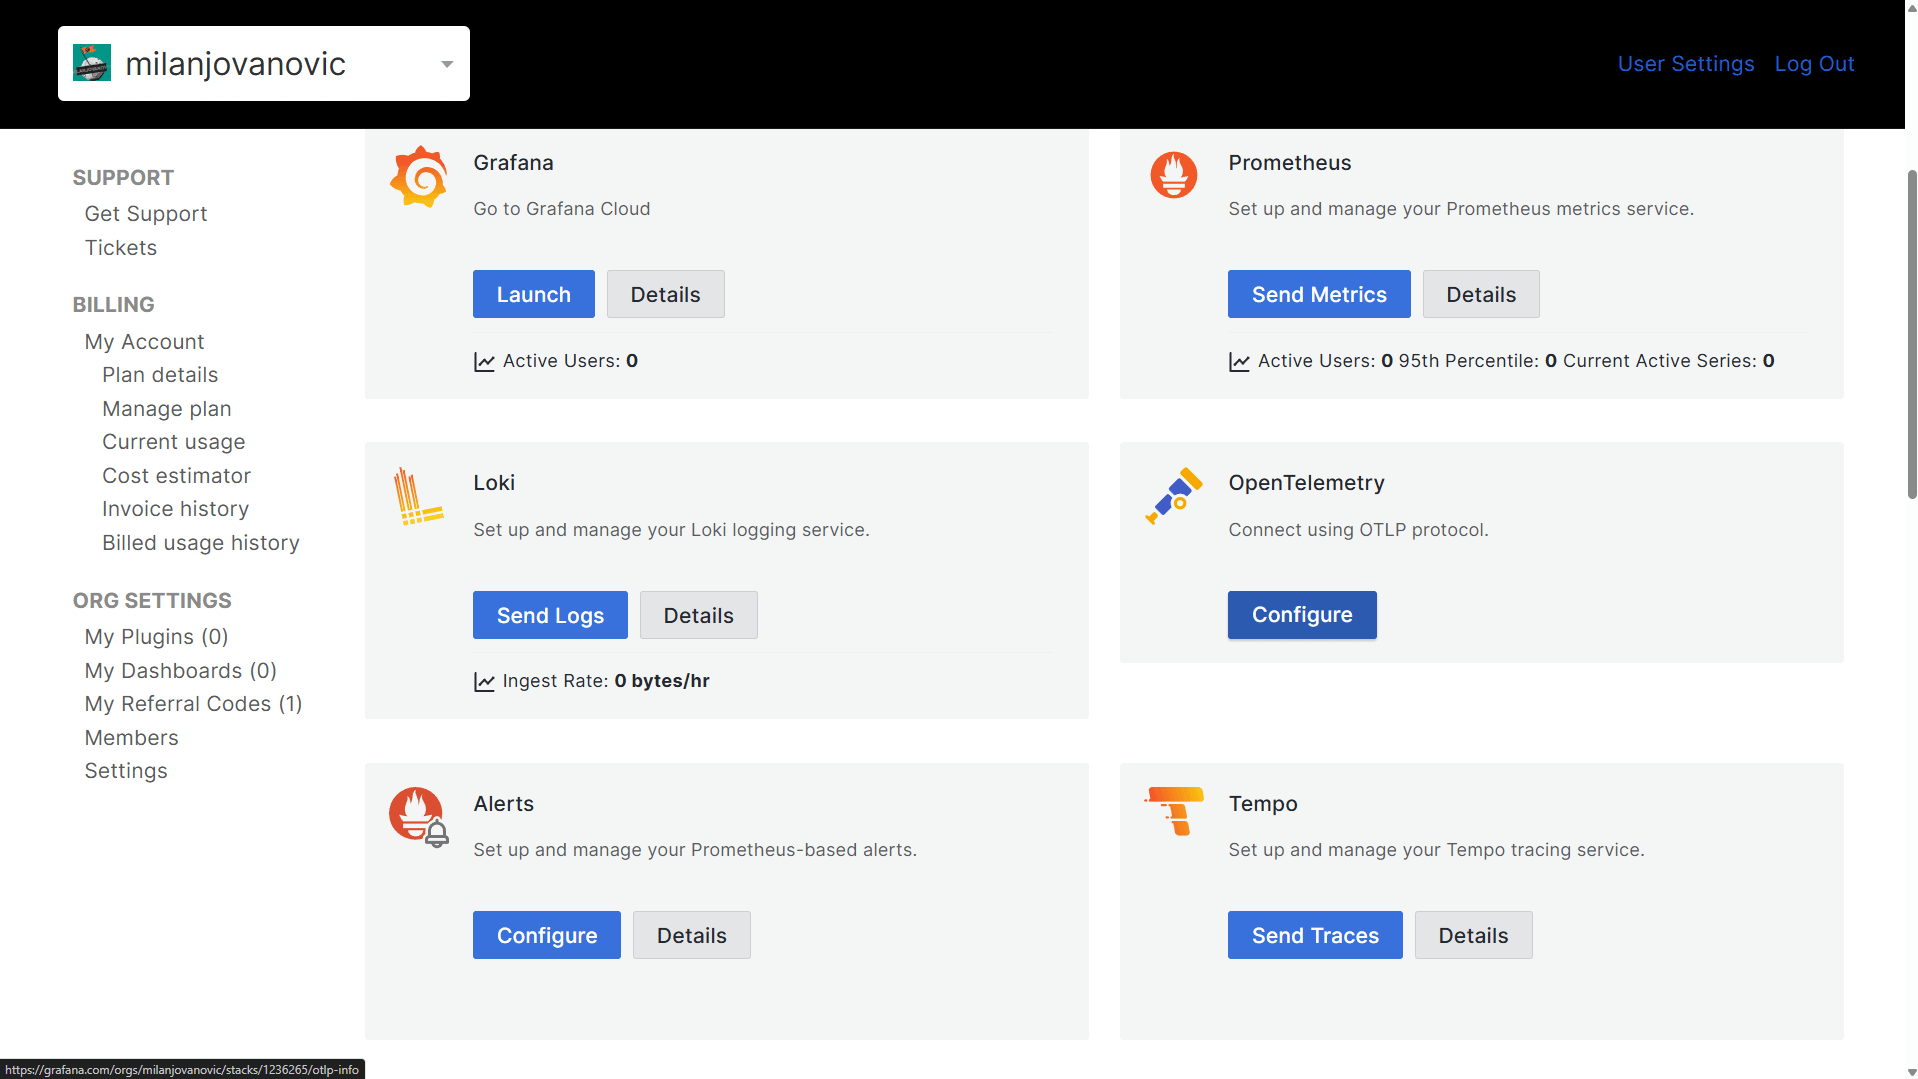
- Find your OTLP endpoint (looks like
https://otlp-gateway-prod-eu-west-2.grafana.net/otlp)
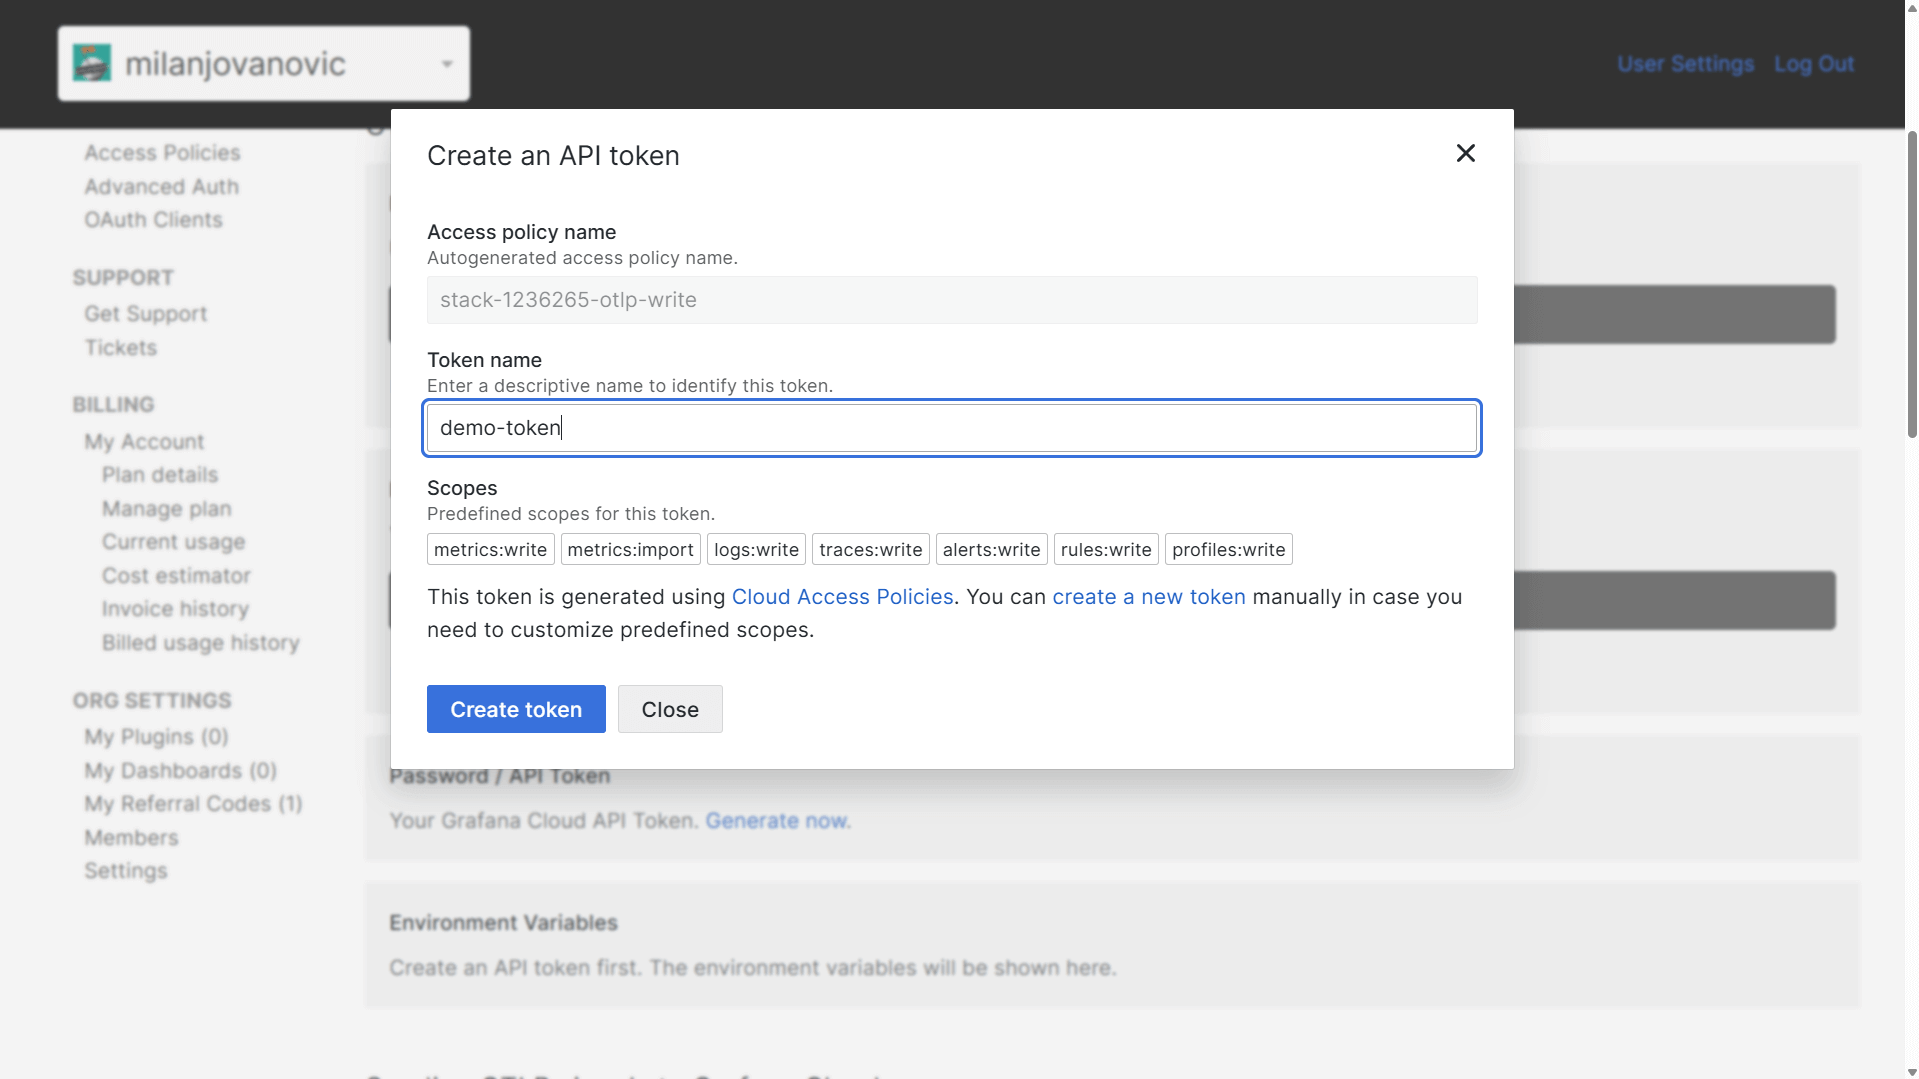
- Generate an API token with permissions
You should also see the environment variables you can use to configure OpenTelemetry:
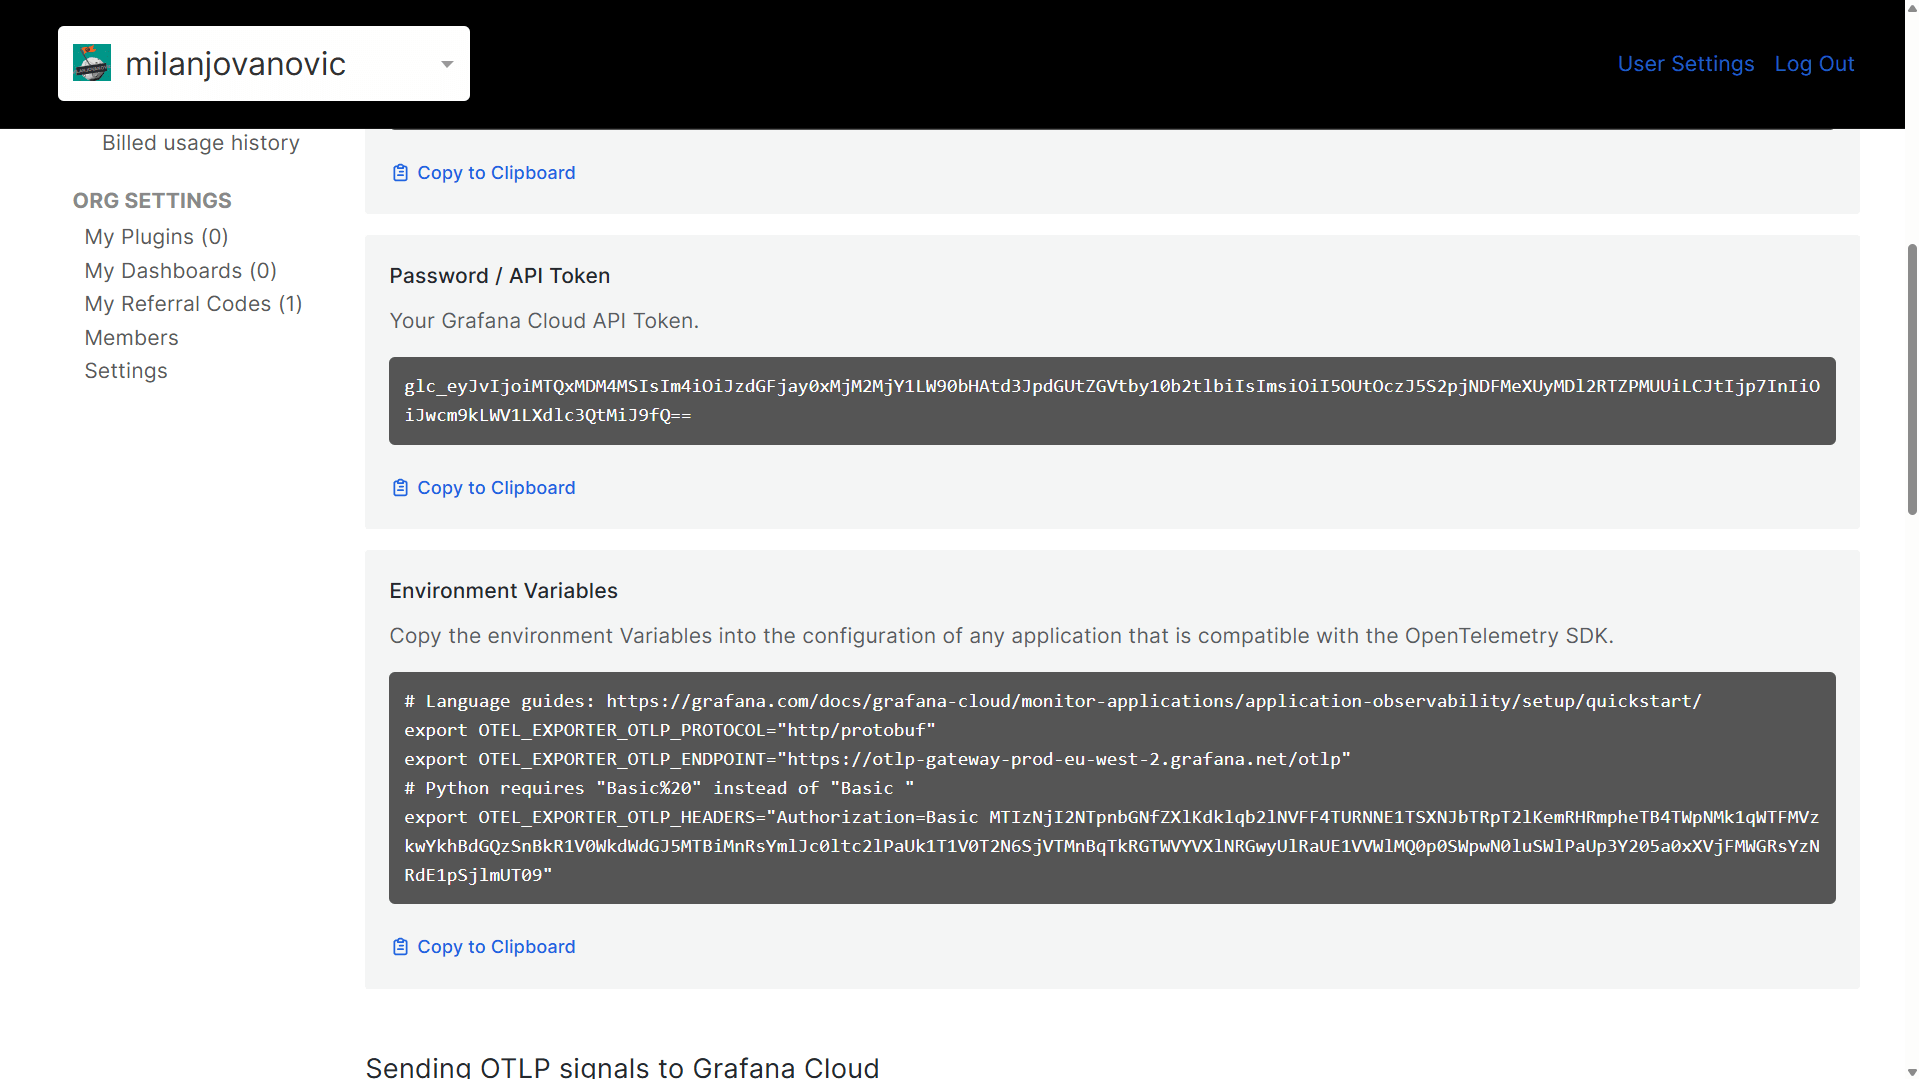
Configure the OTLP exporter in your appsettings.json:
{
  "OTEL_EXPORTER_OTLP_ENDPOINT": "https://otlp-gateway-prod-eu-west-2.grafana.net/otlp",
  "OTEL_EXPORTER_OTLP_PROTOCOL": "http/protobuf",
  "OTEL_EXPORTER_OTLP_HEADERS": "Authorization=Basic <your-base64-encoded-token>"
}
You can also set these as environment variables in your hosting environment.
Viewing and Analyzing Data in Grafana
Start your application and generate some traffic. Now head to your Grafana Cloud instance.
Traces
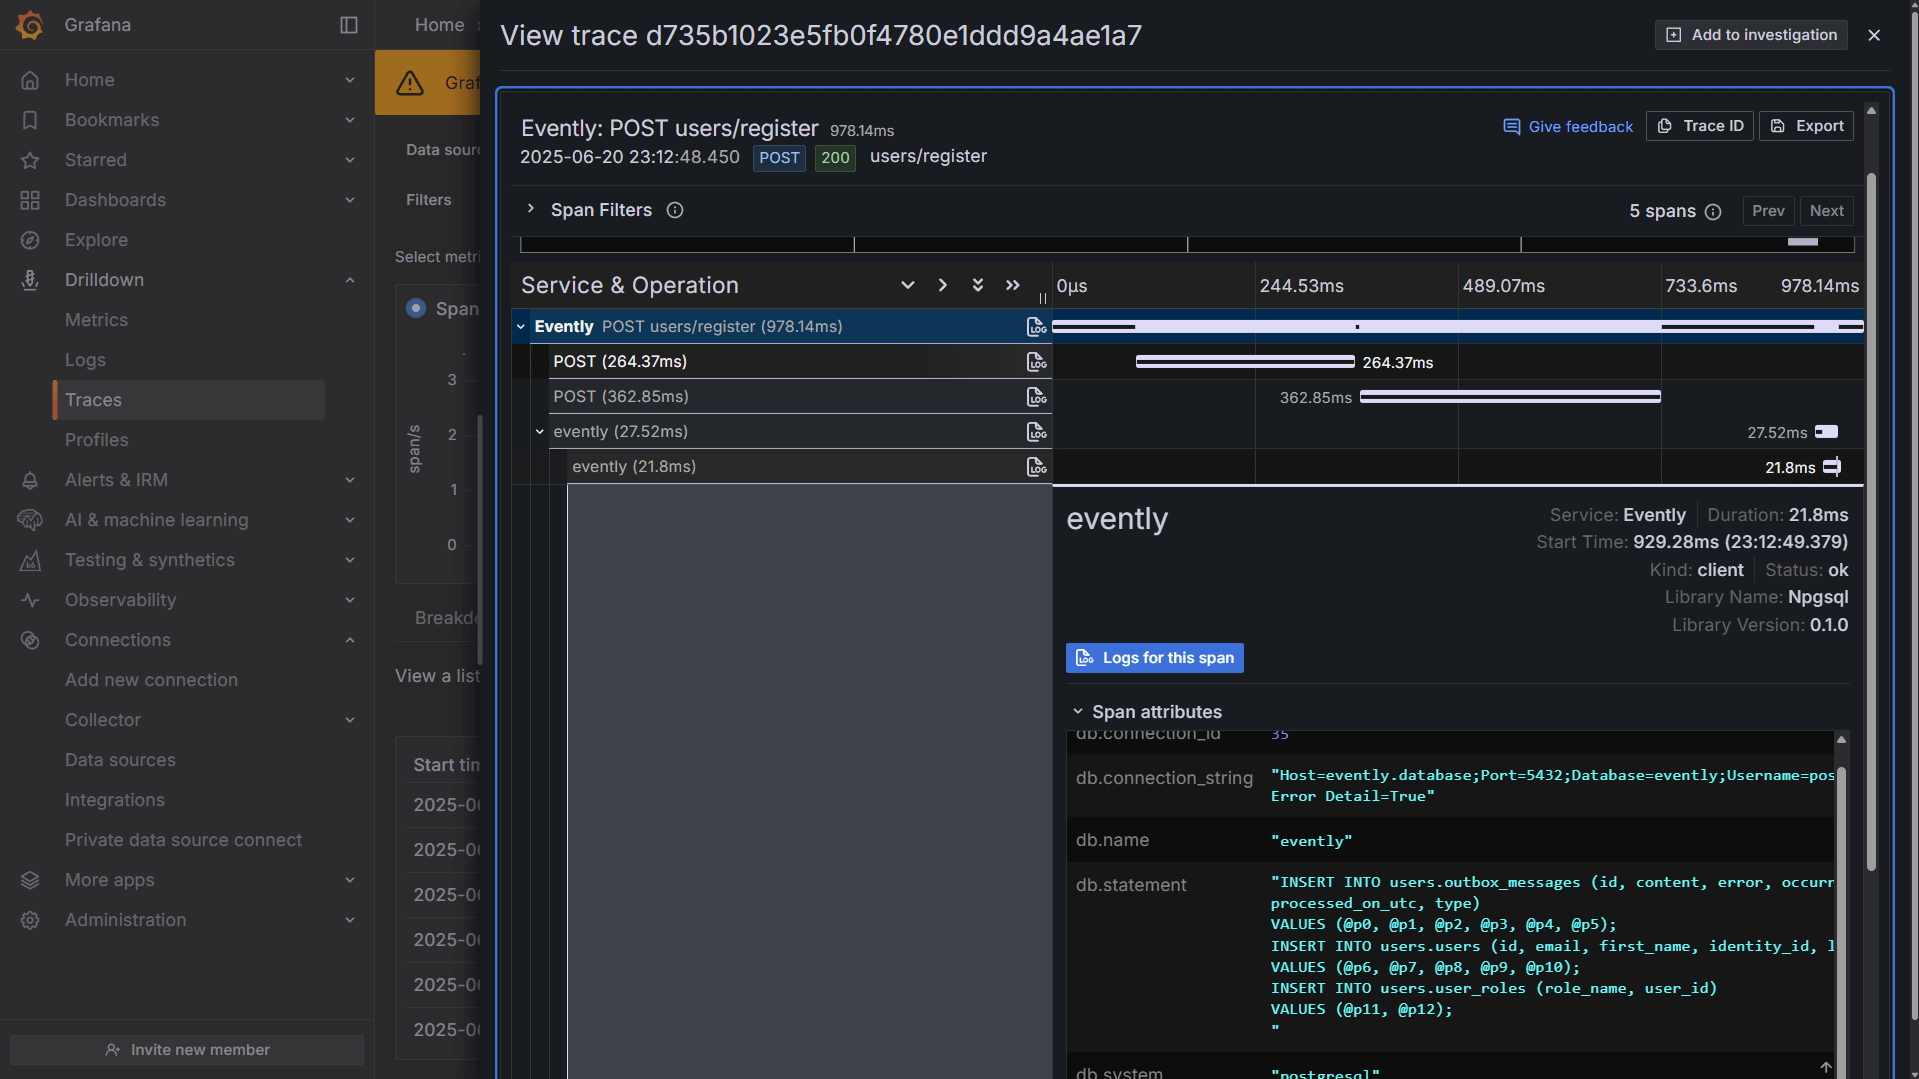
If everything is set up correctly, you should see traces from your application in the Traces section.
Here's an example of a trace view in Grafana Cloud.
It's a POST users/register request that contains multiple spans:
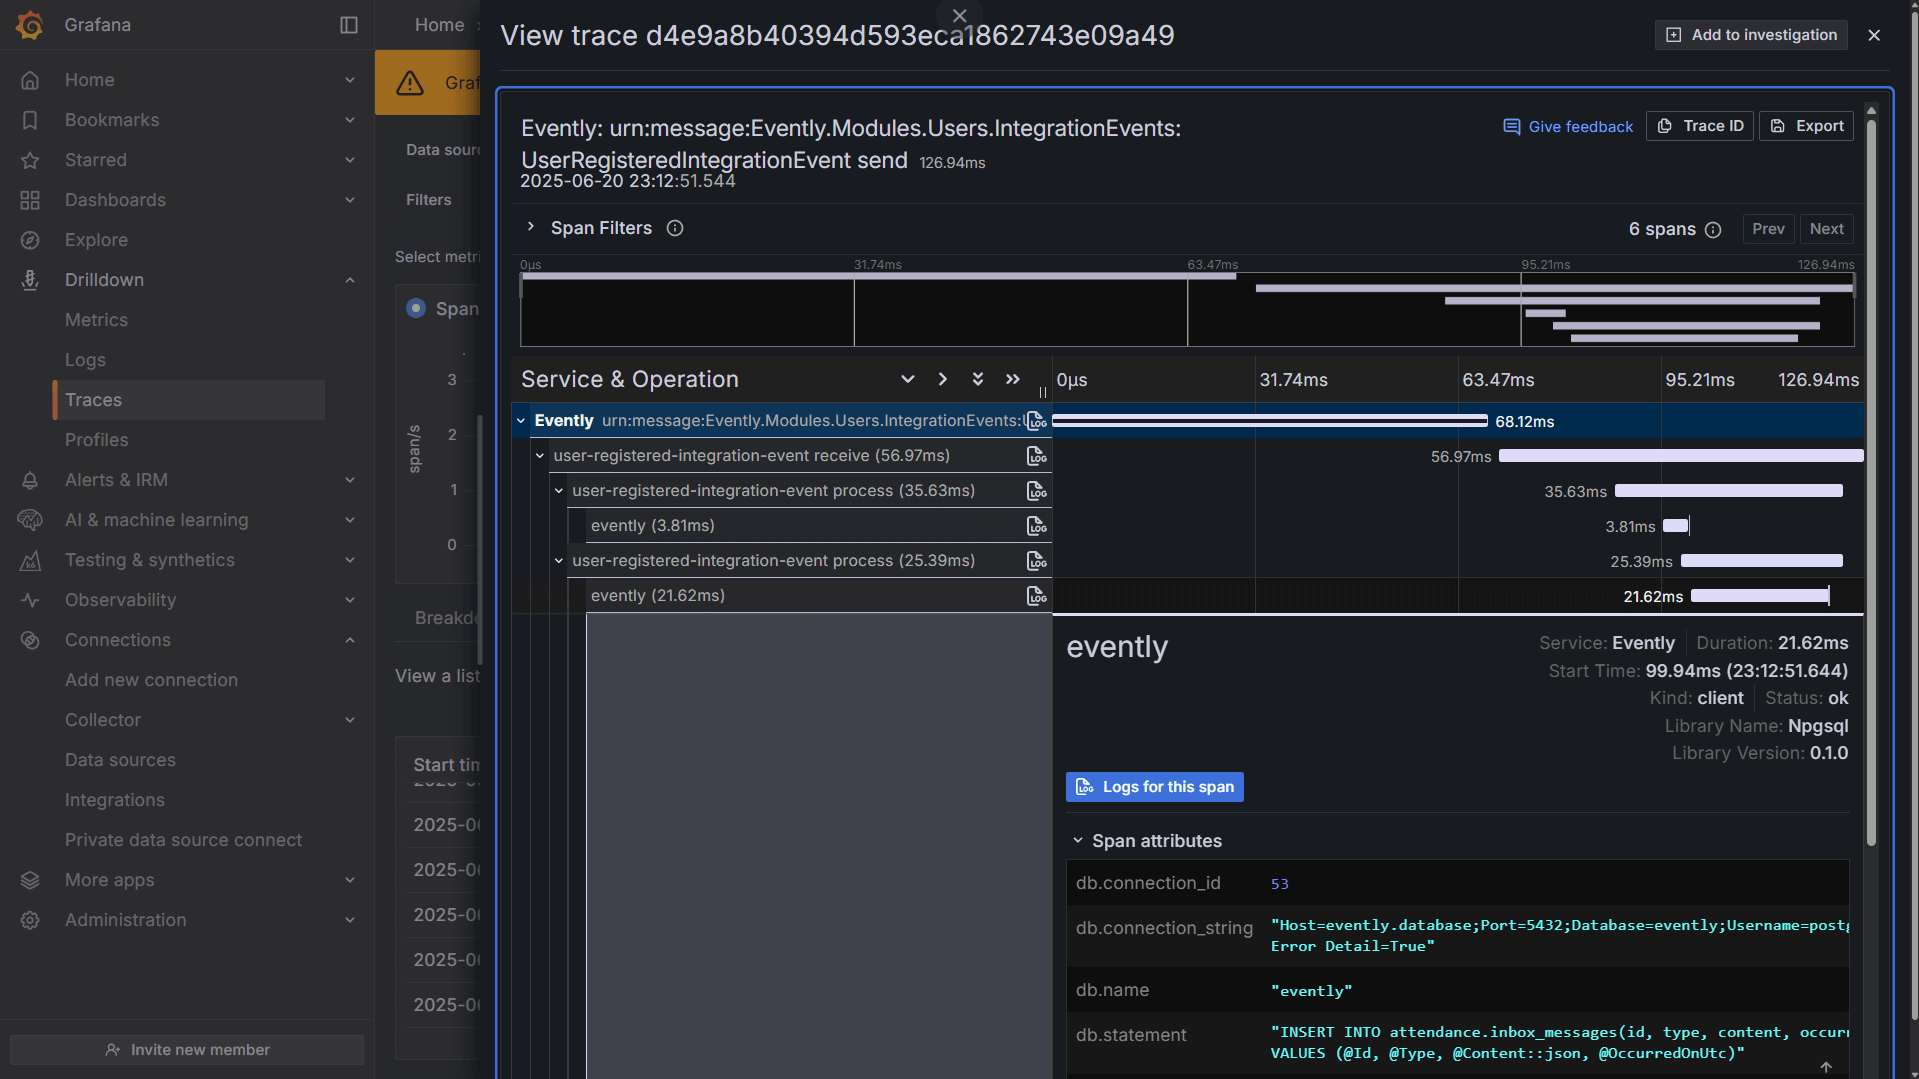
Here's another example of a trace that includes messages sent to a message broker (like RabbitMQ or Kafka).
Logs
You can also view logs in Grafana Cloud.
Here's an example of a log view that shows multiple log entries for our application.
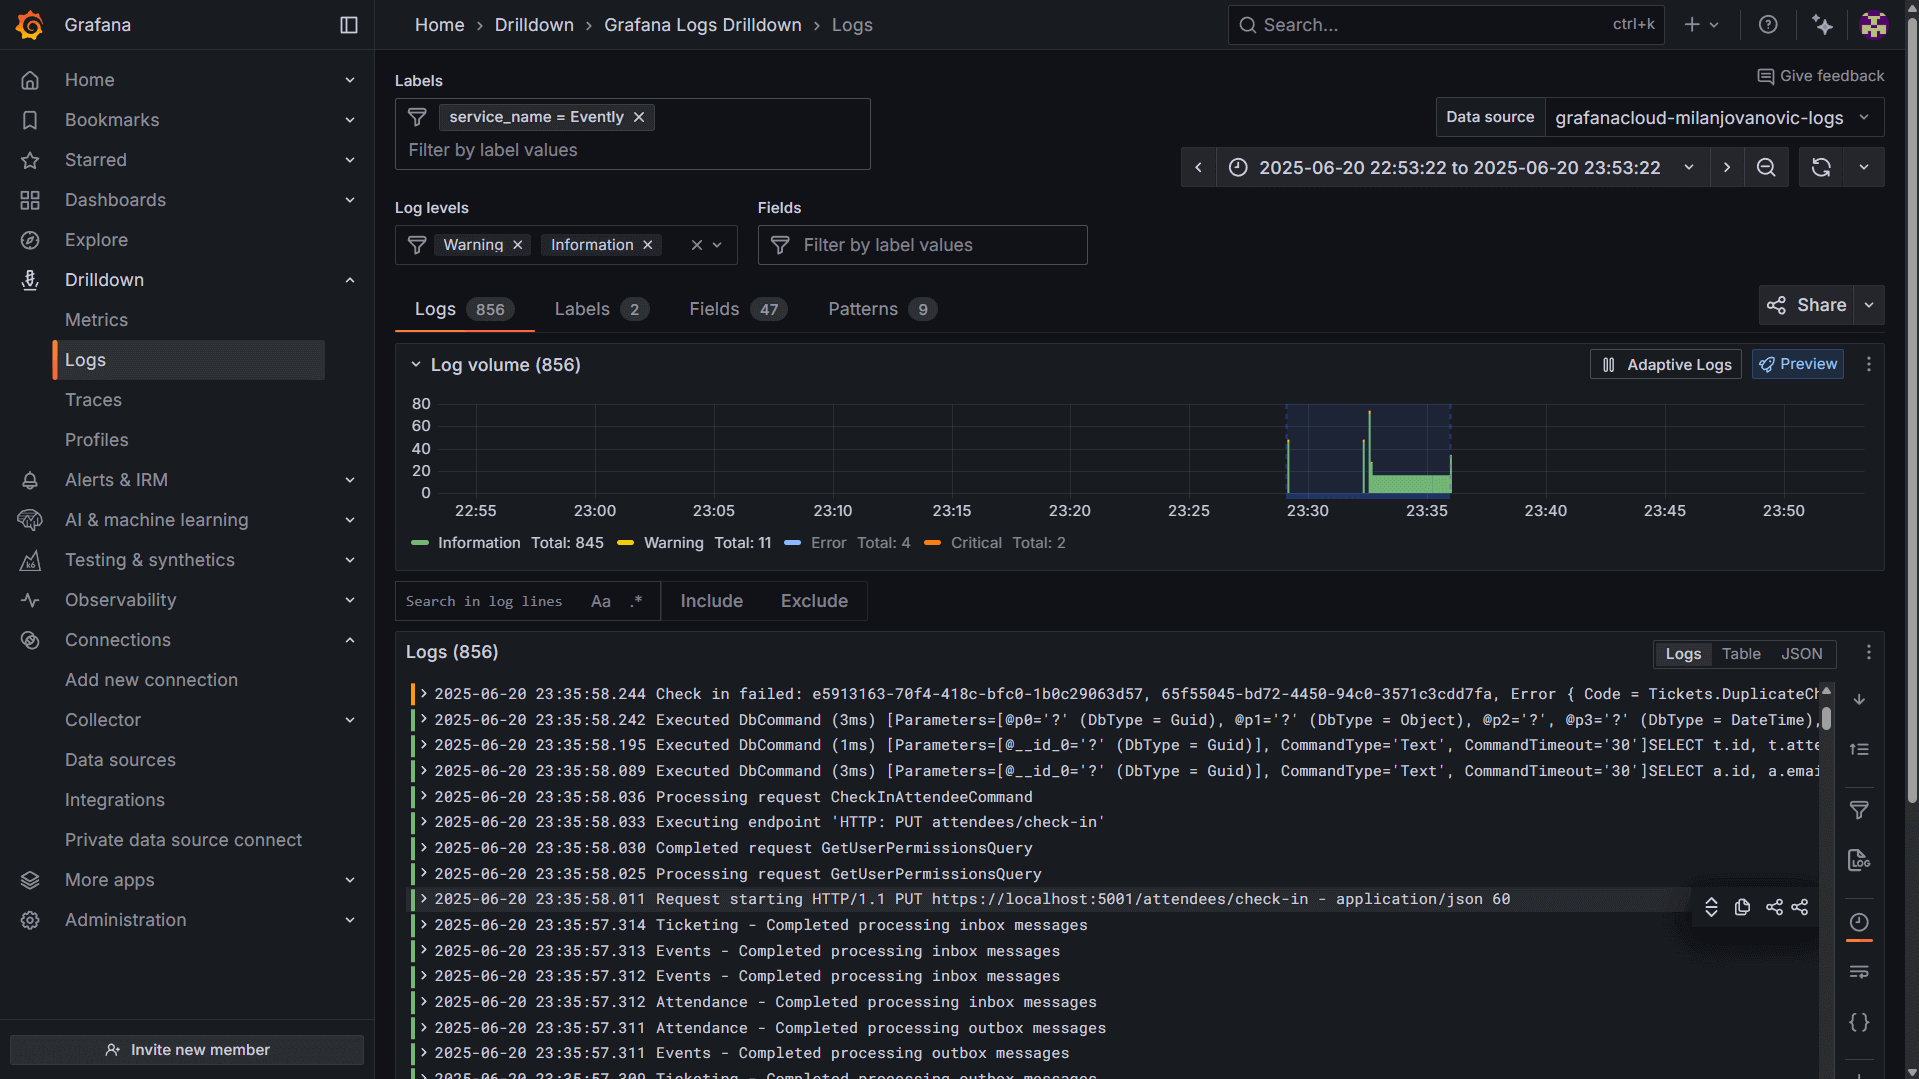
You can drill down into individual log entries, filter by severity, and search for specific terms.
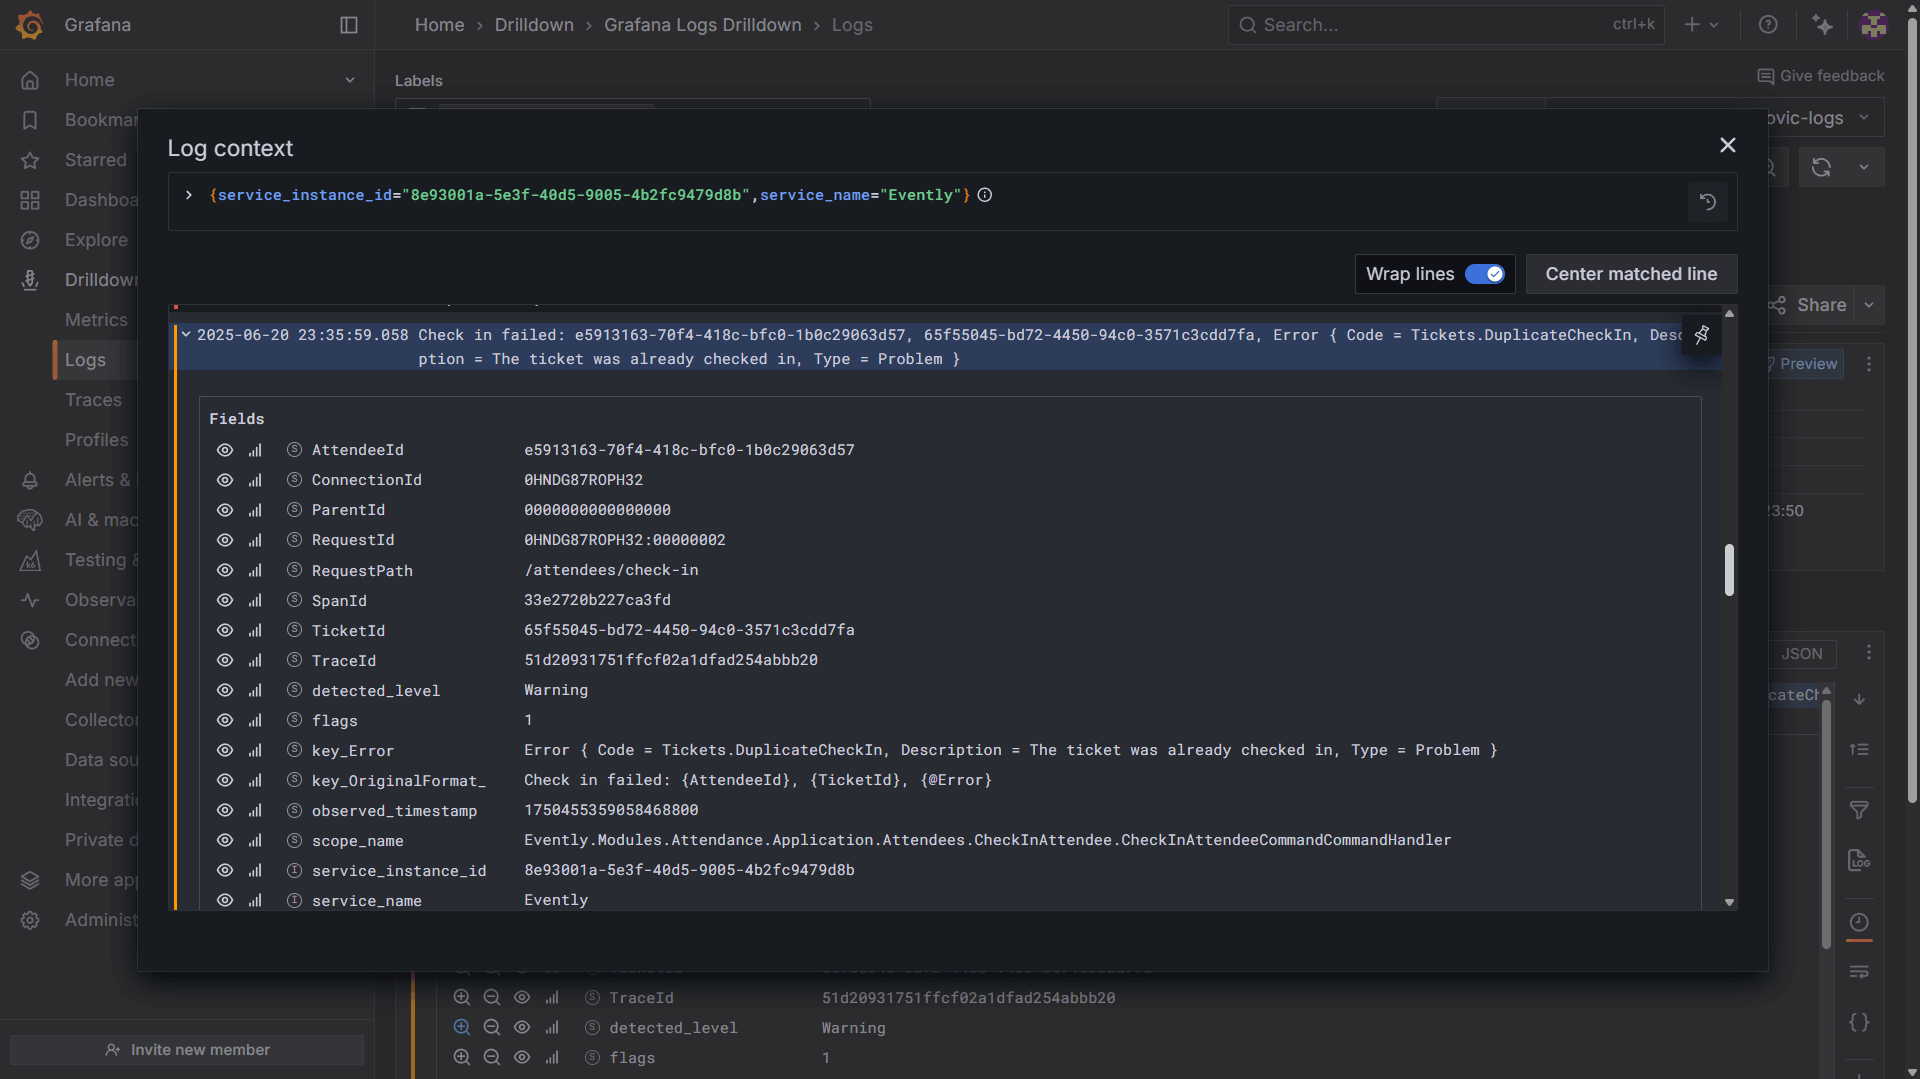
OpenTelemetry automatically correlates your logs with traces. In the trace detail view, click Logs to see all log entries that occurred during that request.
Your logs will include trace and span IDs.
Conclusion
You now have full observability for your .NET application.
When something goes wrong in production, you won't be guessing anymore. You'll see exactly which requests were slow, what errors occurred, and how they propagated through your system.
Grafana gives you the dashboards and alerting to catch problems before users do. OpenTelemetry gives you the detailed traces to understand exactly what happened.
This setup scales from a single service to hundreds of microservices without changing your instrumentation code. And when your apps outgrow a single machine, the collector setup evolves too; I wrote about that next step in the agent + gateway collector pattern.
Ready to take your observability further?
This article showed you the basics, but modern applications need advanced patterns like distributed tracing across event-driven architectures, custom instrumentation strategies, and observability-driven development practices.
I cover all of this in-depth in my Modular Monolith Architecture course, where you'll learn how to implement OpenTelemetry across complex, event-driven systems that actually scale in production.
That's all for today.
See you next Saturday.
Frequently Asked Questions
How do you set up OpenTelemetry in a .NET application?
Install OpenTelemetry.Extensions.Hosting, the OTLP exporter, and the instrumentation packages you need (ASP.NET Core, HttpClient, optionally EF Core, Redis, and Npgsql). Then call AddOpenTelemetry() in Program.cs, configure the service resource, add the instrumentations under WithTracing, and register AddOtlpExporter for traces and logs.
How do you send OpenTelemetry data to Grafana Cloud?
Point the OTLP exporter at your Grafana Cloud stack with three settings: OTEL_EXPORTER_OTLP_ENDPOINT (the OTLP gateway URL from Stack Details), OTEL_EXPORTER_OTLP_PROTOCOL set to http/protobuf, and OTEL_EXPORTER_OTLP_HEADERS carrying a Basic authorization token. Set them in appsettings.json or as environment variables.
What is Grafana used for?
Grafana is an observability platform that unifies metrics, logs, and traces in one place, with dashboards, alerting, deep trace analysis, and log correlation. Grafana Cloud is the hosted version with no infrastructure to manage, built-in OpenTelemetry integrations, and a free tier to start on.
Does OpenTelemetry correlate logs with traces?
Yes, automatically. Exported log entries carry the trace and span IDs of the request they belong to, so in Grafana's trace detail view you can click Logs and see exactly the log entries that occurred during that request instead of searching by timestamp.
Can you trace Entity Framework Core and Redis calls with OpenTelemetry?
Yes. Dedicated instrumentation packages exist for both: OpenTelemetry.Instrumentation.EntityFrameworkCore and OpenTelemetry.Instrumentation.StackExchangeRedis, plus Npgsql.OpenTelemetry for PostgreSQL. Add them to the tracing pipeline and database and cache calls show up as spans inside your request traces.