
The Aspire Dashboard ships as a standalone container image, mcr.microsoft.com/dotnet/aspire-dashboard, so you can drop it into Docker Compose without adopting Aspire orchestration.
Services export telemetry to it over OTLP on port 18889, and the UI runs on 18888.
Storage is in memory only, so it is meant for local development and debugging.
Meet Auggie CLI. Augment Code is bringing the power of its AI coding agent and context engine right to your terminal. You can use Auggie in a standalone interactive terminal session alongside your favorite editor or in any part of your software development stack. Auggie CLI is now generally available.
Build AI Agents with Postman. Design, test, and launch AI agents effortlessly with Postman. Use trusted APIs and no-code tools to build workflows and transform them into agent-ready code. Postman gives you everything you need to design, test and launch AI Agents—all in one platform. Start Building.
You've built a distributed .NET application. Multiple services, databases, message queues. Now something's slow, and you need to figure out why.
The Aspire Dashboard runs perfectly as a standalone container, giving you distributed tracing, structured logs, and real-time metrics without the full orchestration framework.
While Aspire's orchestration is incredibly powerful for managing distributed applications, sometimes you just need the observability piece. Maybe you're already using Docker Compose or Kubernetes. Maybe you're debugging an existing system. The standalone dashboard gives you valuable telemetry visualization with minimal setup.
Let's get it running in under 5 minutes.
Why Run the Aspire Dashboard Standalone?
Most teams already have their deployment story figured out. Docker Compose, Kubernetes, or some platform-specific orchestration. You don't want to rewrite everything just to get observability.
The standalone Aspire Dashboard hits a sweet spot for development:
- Drop-in observability - Just add a container to your existing setup
- Full OpenTelemetry support - Works with any OTLP-compatible application
- Developer-friendly - Designed for local development and debugging
- Immediate value - See traces, logs, and metrics within minutes
One caveat: it's in-memory only. Perfect for development and debugging, not for production. For production, you'll want something like Jaeger, Prometheus, or a commercial APM solution.
But for understanding what your code is doing right now? It's exactly what you need.
Step 1: Add the Dashboard Container
Drop this into your docker-compose.yml:
aspire-dashboard:
  container_name: aspire-dashboard
  image: mcr.microsoft.com/dotnet/aspire-dashboard:13.0
  ports:
    - 18888:18888
That's it. The dashboard is running.
Navigate to http://localhost:18888 and... you'll need a token.
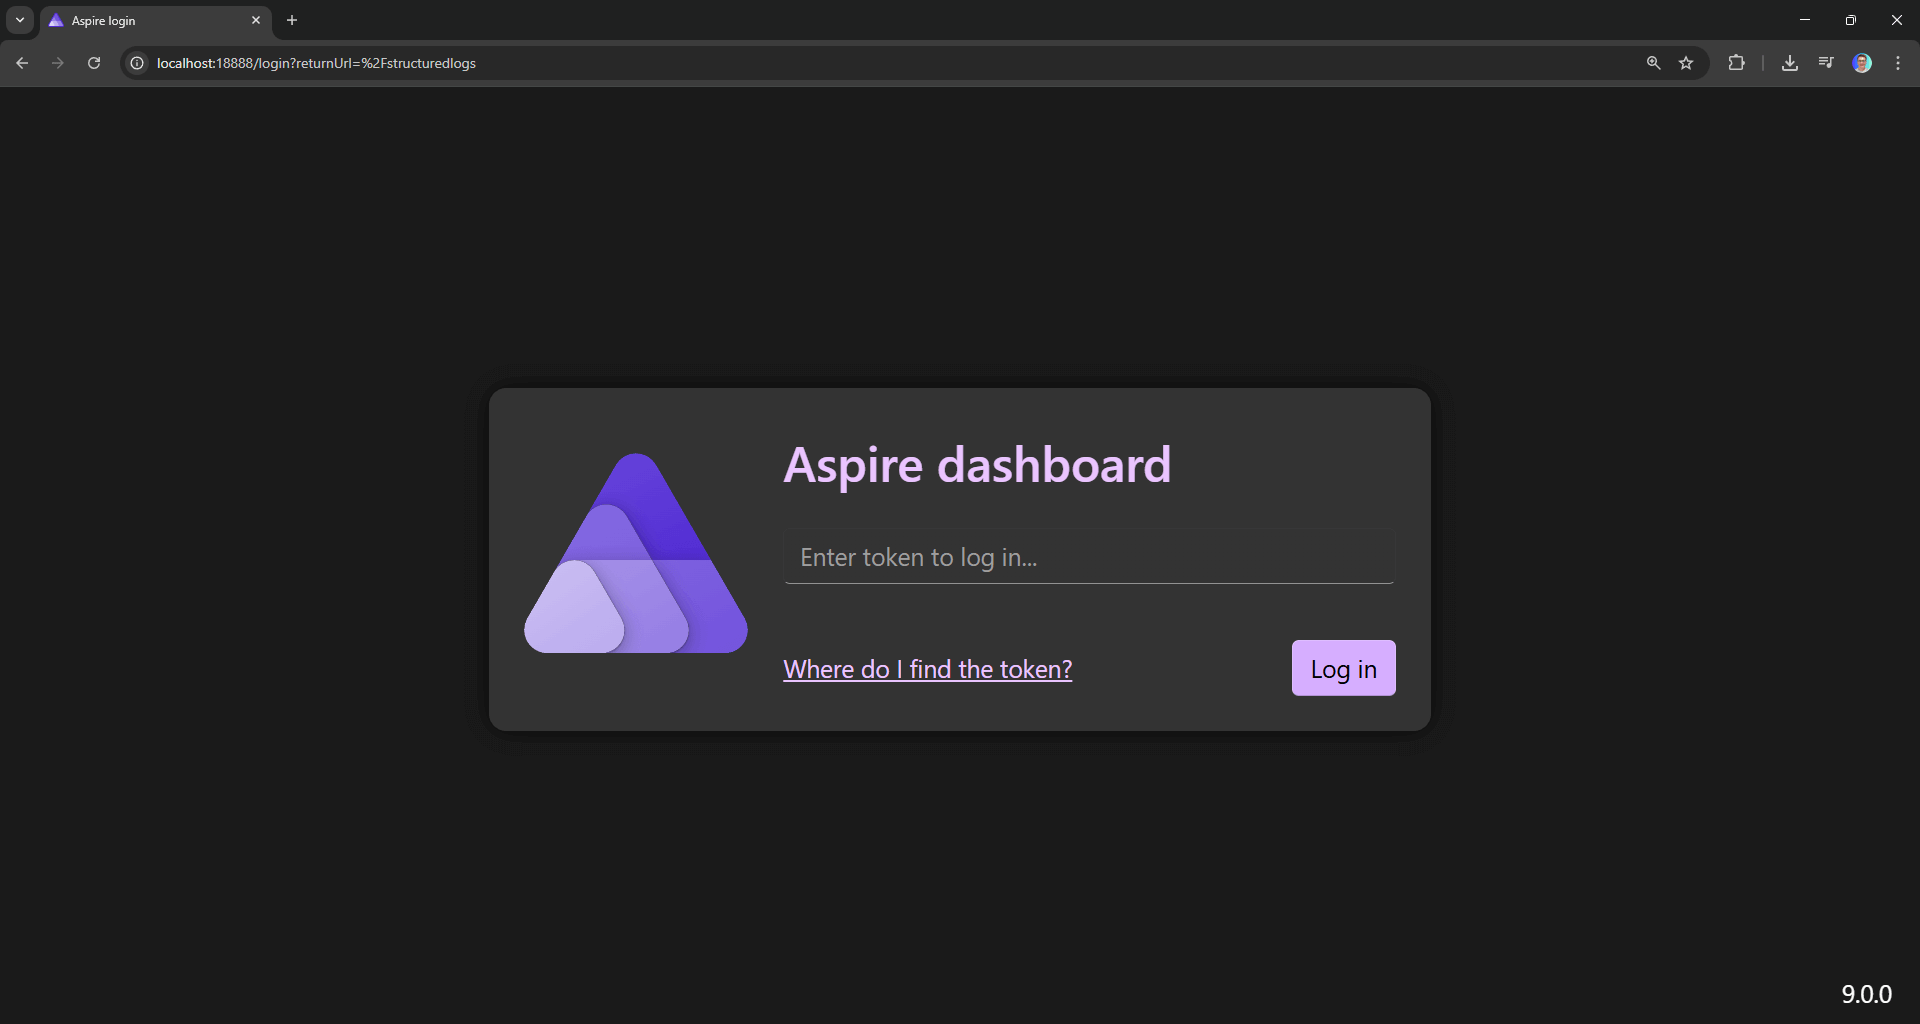
Check the container logs for the login link. The dashboard generates a unique authentication token on startup:
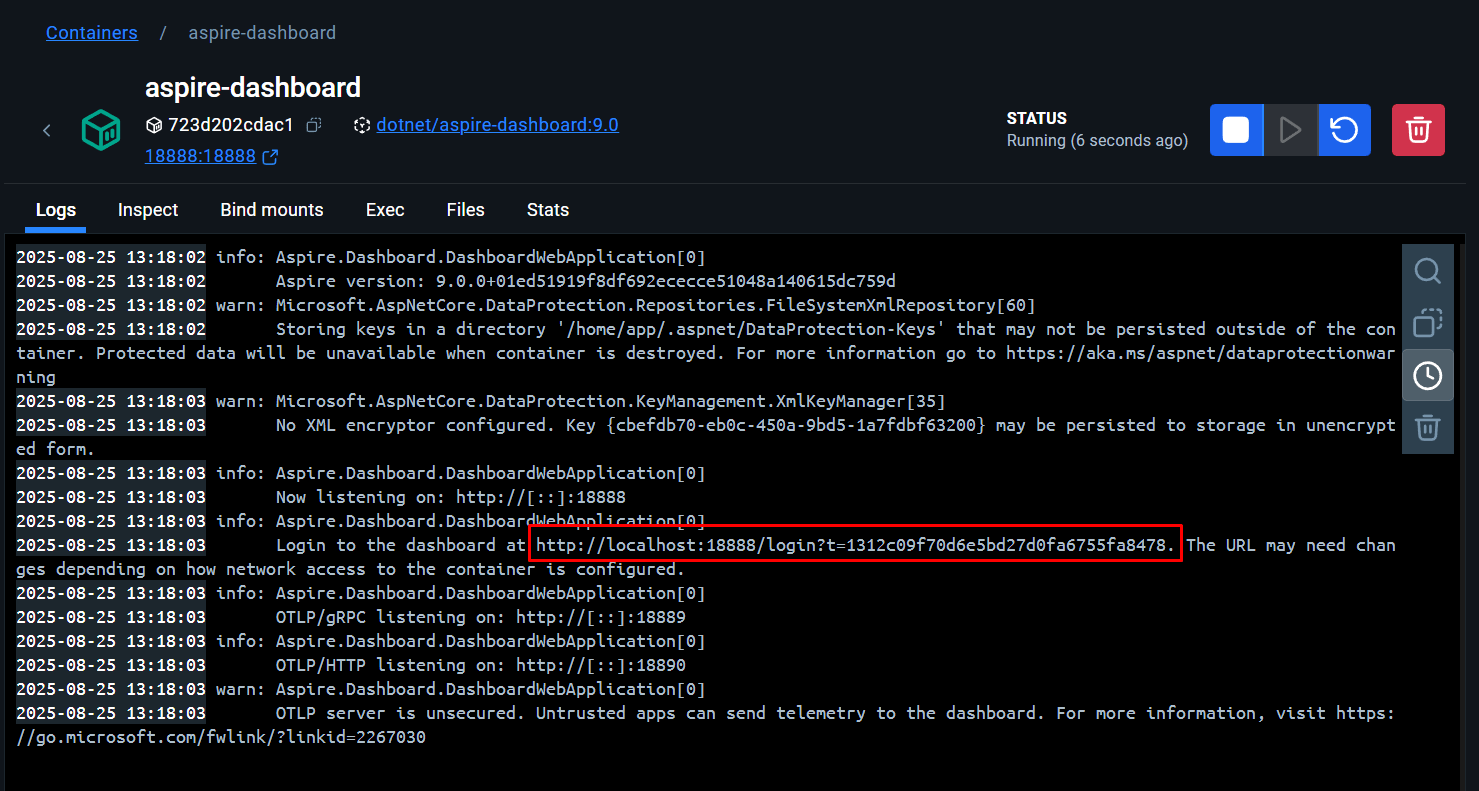
Click that link, and you're in. Empty for now, but not for long.
Step 2: Wire Up Your .NET Services
Your services need to know where to send their telemetry. Add these environment variables to your API containers:
users.api:
  image: ${DOCKER_REGISTRY-}usersapi
  build:
    context: .
    dockerfile: Users.Api/Dockerfile
  ports:
    - 5100:5100
    - 5101:5101
  environment:
    - OTEL_EXPORTER_OTLP_ENDPOINT=http://aspire-dashboard:18889
    - OTEL_EXPORTER_OTLP_PROTOCOL=grpc
  depends_on:
    - users.database
Notice port 18889?
That's the OTLP ingestion endpoint.
The dashboard listens on 18888 for the UI, 18889 for telemetry data.
Step 3: Configure OpenTelemetry in Your Code
Install the necessary OpenTelemetry packages:
<PackageReference Include="Npgsql.OpenTelemetry" Version="9.0.3" />
<PackageReference Include="OpenTelemetry.Exporter.OpenTelemetryProtocol" Version="1.12.0" />
<PackageReference Include="OpenTelemetry.Extensions.Hosting" Version="1.12.0" />
<PackageReference Include="OpenTelemetry.Instrumentation.AspNetCore" Version="1.12.0" />
<PackageReference Include="OpenTelemetry.Instrumentation.Http" Version="1.12.0" />
Then configure OpenTelemetry in your Program.cs:
builder.Services.AddOpenTelemetry()
    .ConfigureResource(resource => resource.AddService(builder.Environment.ApplicationName))
    .WithTracing(tracing => tracing
        .AddHttpClientInstrumentation()
        .AddAspNetCoreInstrumentation()
        .AddNpgsql())
    .WithMetrics(metrics => metrics
        .AddHttpClientInstrumentation()
        .AddAspNetCoreInstrumentation());

builder.Logging.AddOpenTelemetry(options =>
{
    options.IncludeScopes = true;
    options.IncludeFormattedMessage = true;
});

builder.Services.AddOpenTelemetry().UseOtlpExporter();
This configuration:
- Traces HTTP calls, ASP.NET Core requests, and database queries
- Collects metrics on request duration, response codes, and throughput
- Structured logging with full context and formatted messages
- Exports everything to the Aspire Dashboard via OTLP
The UseOtlpExporter() method automatically picks up the OTEL_EXPORTER_OTLP_ENDPOINT environment variable you configured earlier.
What You Get
Start your application and make a few requests. The dashboard immediately lights up with data.
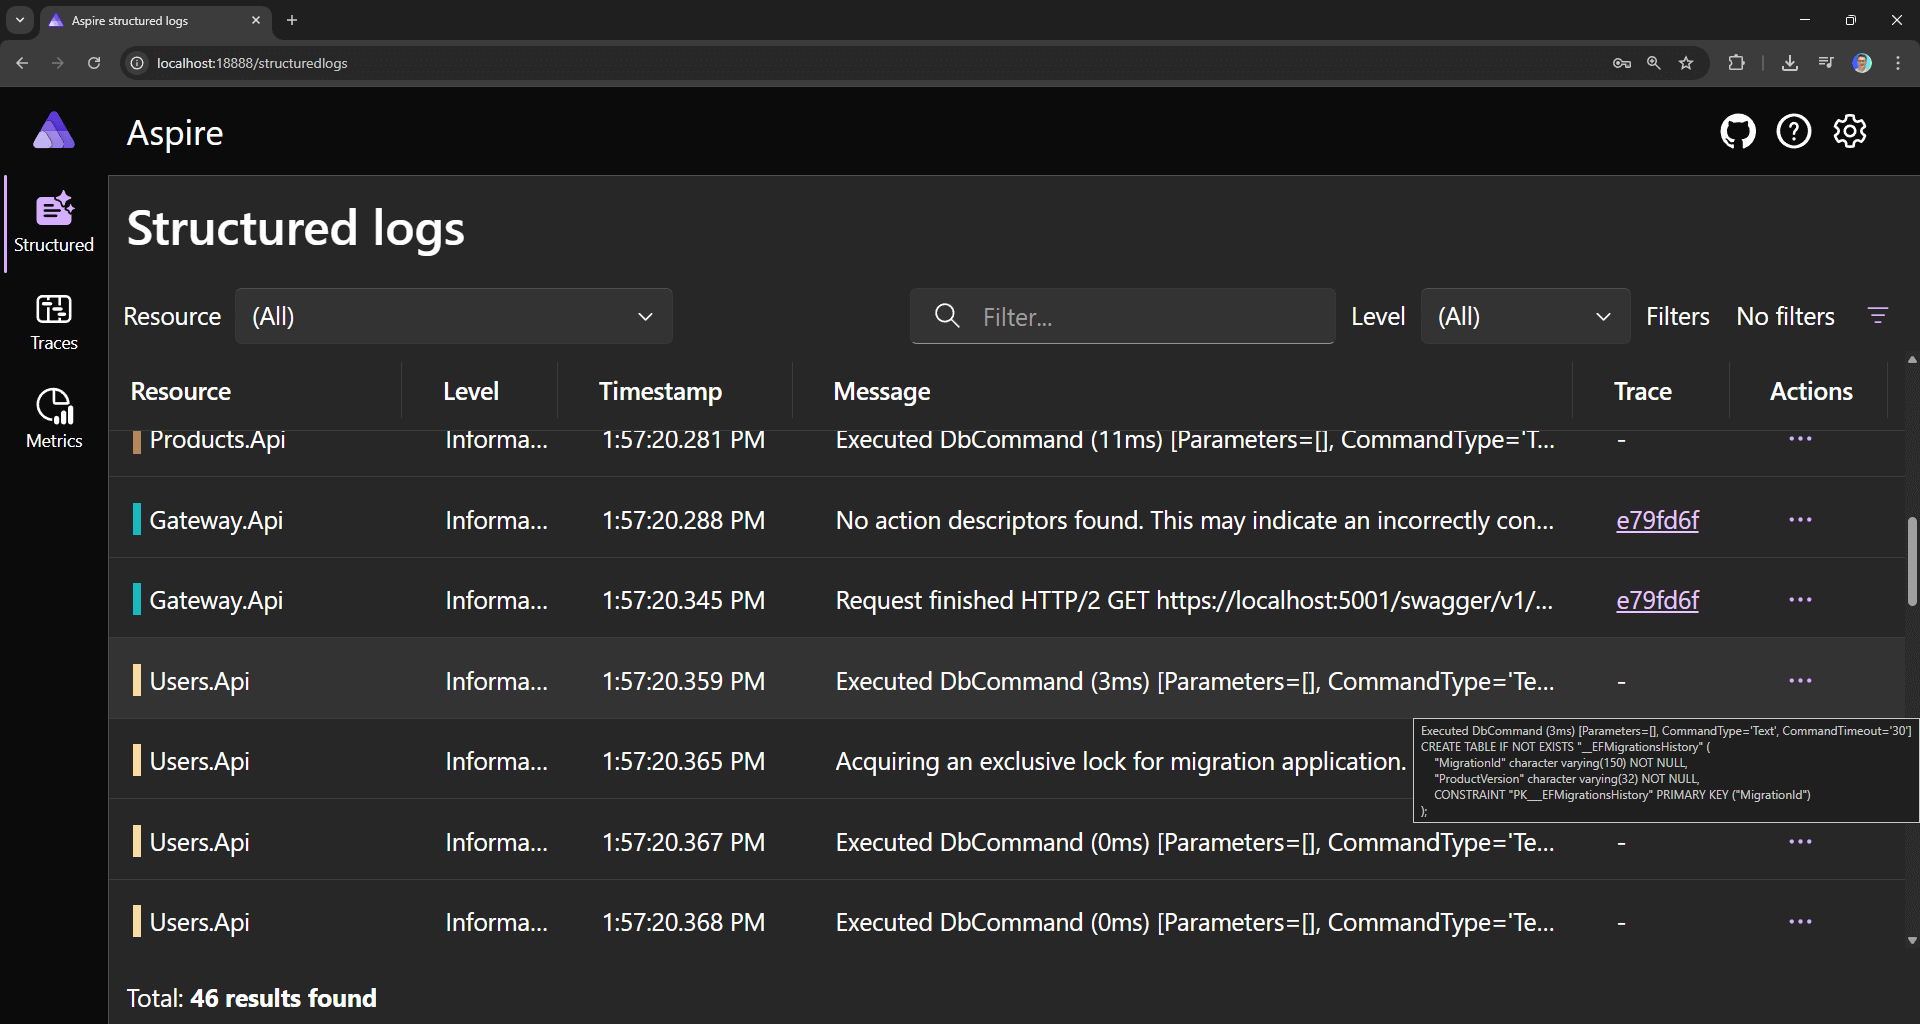
Structured Logs
Every log entry includes full context: trace IDs, request paths, user identities. Click any log to see the complete structured data.
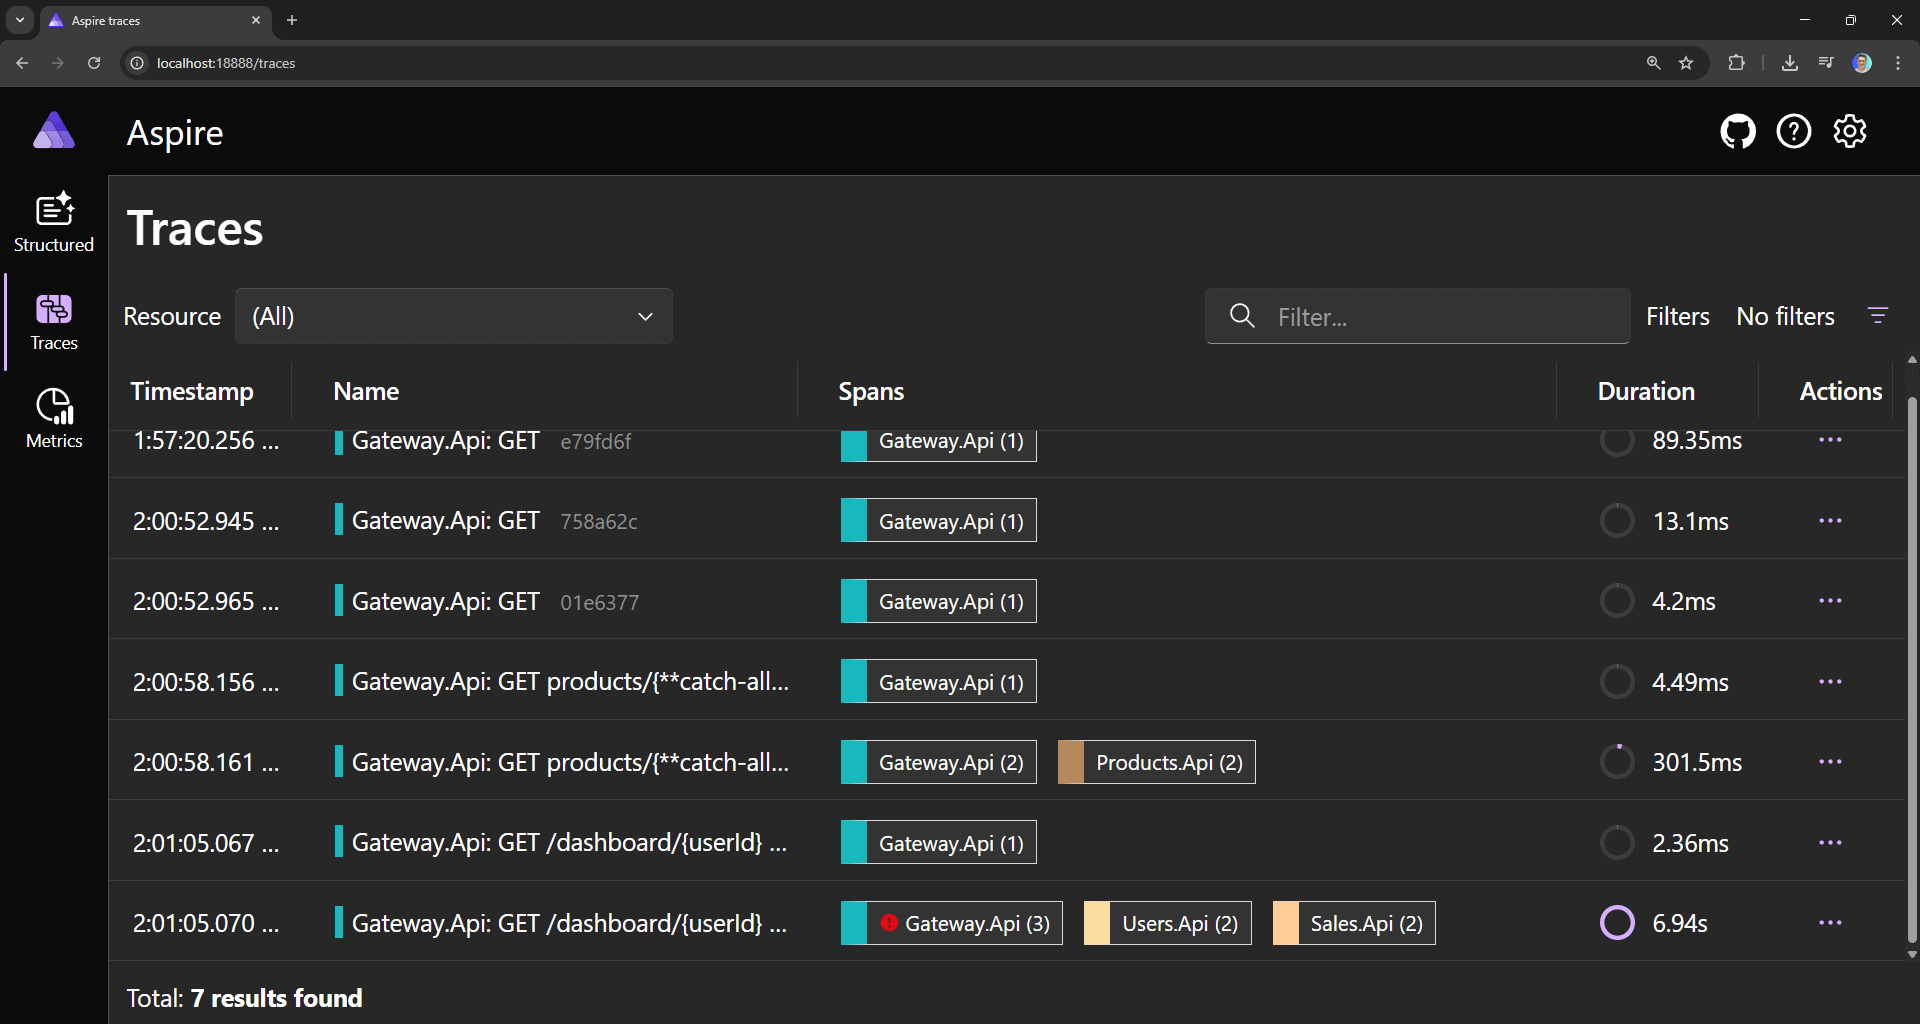
Distributed Traces
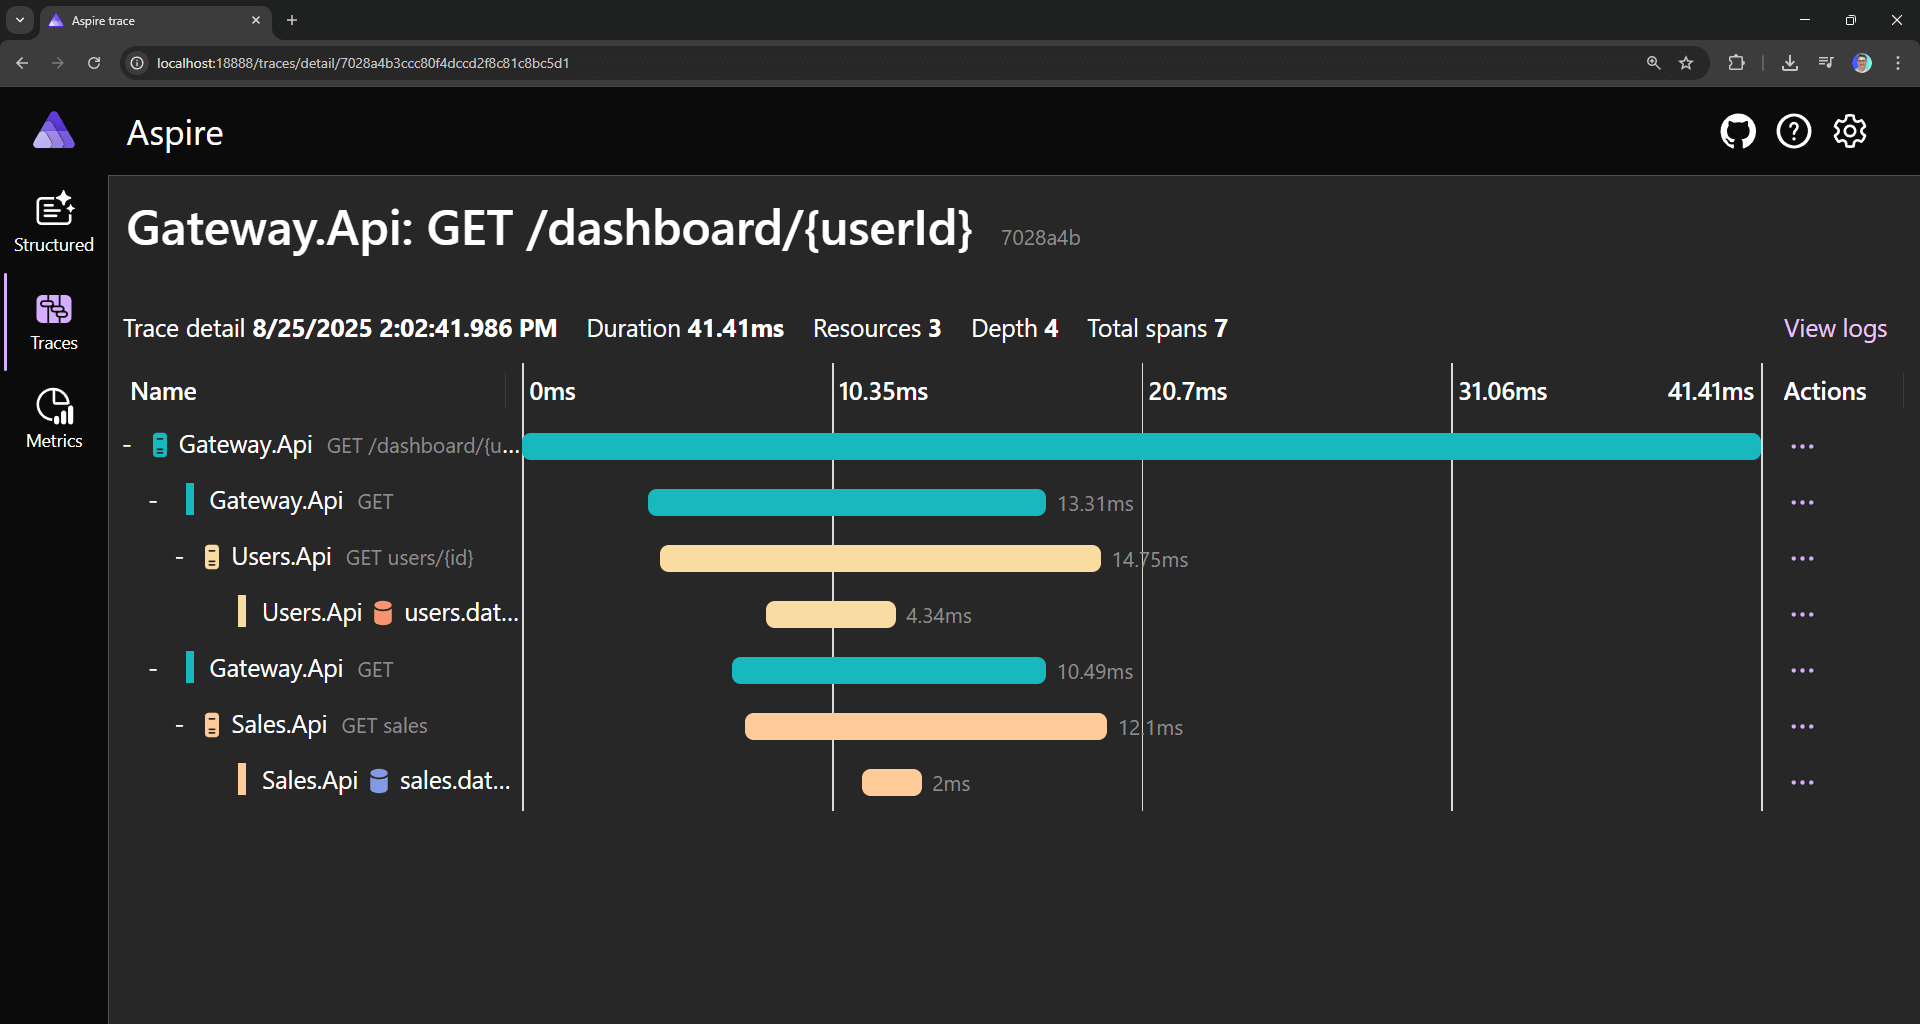
See the complete request flow across all your services. Which database query is slow? Which HTTP call is failing? The trace view shows you exactly where time is spent.
You can click into a trace to see the individual spans and any metadata associated with them.
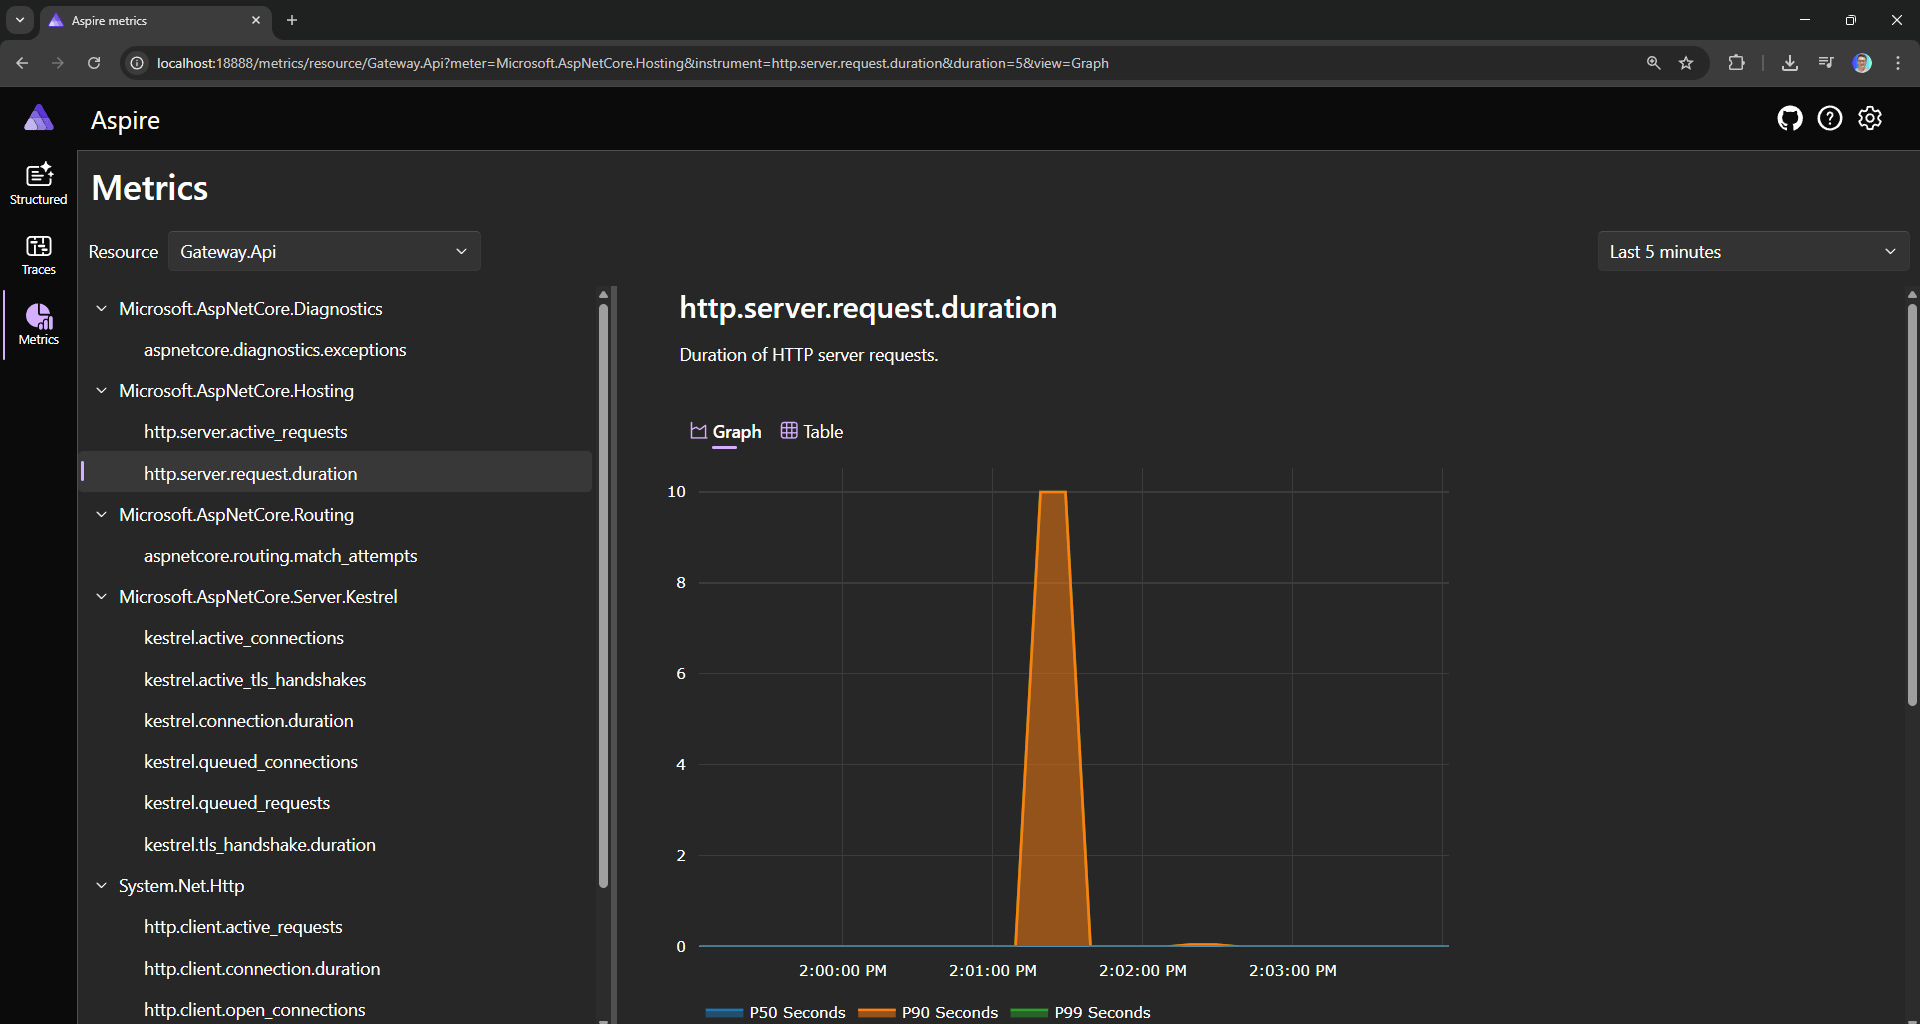
Real-Time Metrics
Response times, error rates, throughput, all updating live. Perfect for load testing or understanding traffic patterns.
Summary
The standalone Aspire Dashboard is perfect for local development and debugging. Spin up your stack, make requests, and instantly see what's happening across all your services. Find bottlenecks in the trace view, correlate logs with requests, watch metrics update in real-time.
Remember: this is for development only since data is in-memory and disappears on restart. That last part might be fixed soon, according to the Aspire roadmap. For production, you'll want proper solutions like Jaeger for tracing, Prometheus for metrics, or a commercial APM like Application Insights.
But for that immediate "what is my code actually doing?" question during development? You've got professional observability in under 5 minutes.
Just add the container, configure OpenTelemetry, and start debugging like a pro.
That's all for today.
See you next Saturday.
Frequently Asked Questions
Can you use the Aspire Dashboard without the full Aspire orchestration?
Yes. The Aspire Dashboard runs as a standalone container (mcr.microsoft.com/dotnet/aspire-dashboard) and accepts telemetry from any OTLP-compatible application. You can drop it into an existing Docker Compose or Kubernetes setup and get distributed traces, structured logs, and real-time metrics.
Is the standalone Aspire Dashboard suitable for production?
No. It stores telemetry in memory only, so all data disappears when the container restarts. It is meant for local development and debugging. For production, use Jaeger for tracing, Prometheus for metrics, or a commercial APM like Application Insights.
What ports does the Aspire Dashboard use?
Two ports: 18888 serves the dashboard UI and 18889 is the OTLP ingestion endpoint that receives telemetry. Point each service at the dashboard by setting OTEL_EXPORTER_OTLP_ENDPOINT to the container address on port 18889 and OTEL_EXPORTER_OTLP_PROTOCOL to grpc.
How do you send telemetry from a .NET service to the Aspire Dashboard?
Install the OpenTelemetry packages, configure tracing, metrics, and logging with AddOpenTelemetry in Program.cs, and call UseOtlpExporter. The exporter automatically picks up the OTEL_EXPORTER_OTLP_ENDPOINT environment variable, so no endpoint needs to be hardcoded.
Why does the Aspire Dashboard ask for a login token?
The dashboard generates a unique authentication token every time it starts. Check the container logs for a login link that includes the token, then open that link in the browser to access the dashboard.